Cover Glass Design for Industrial Displays: Thickness, Coatings, Printing and Edges
Cover glass design for industrial displays: thickness and strengthening, AG and AR coatings by measurement, printing step height, edge treatment and tooling.
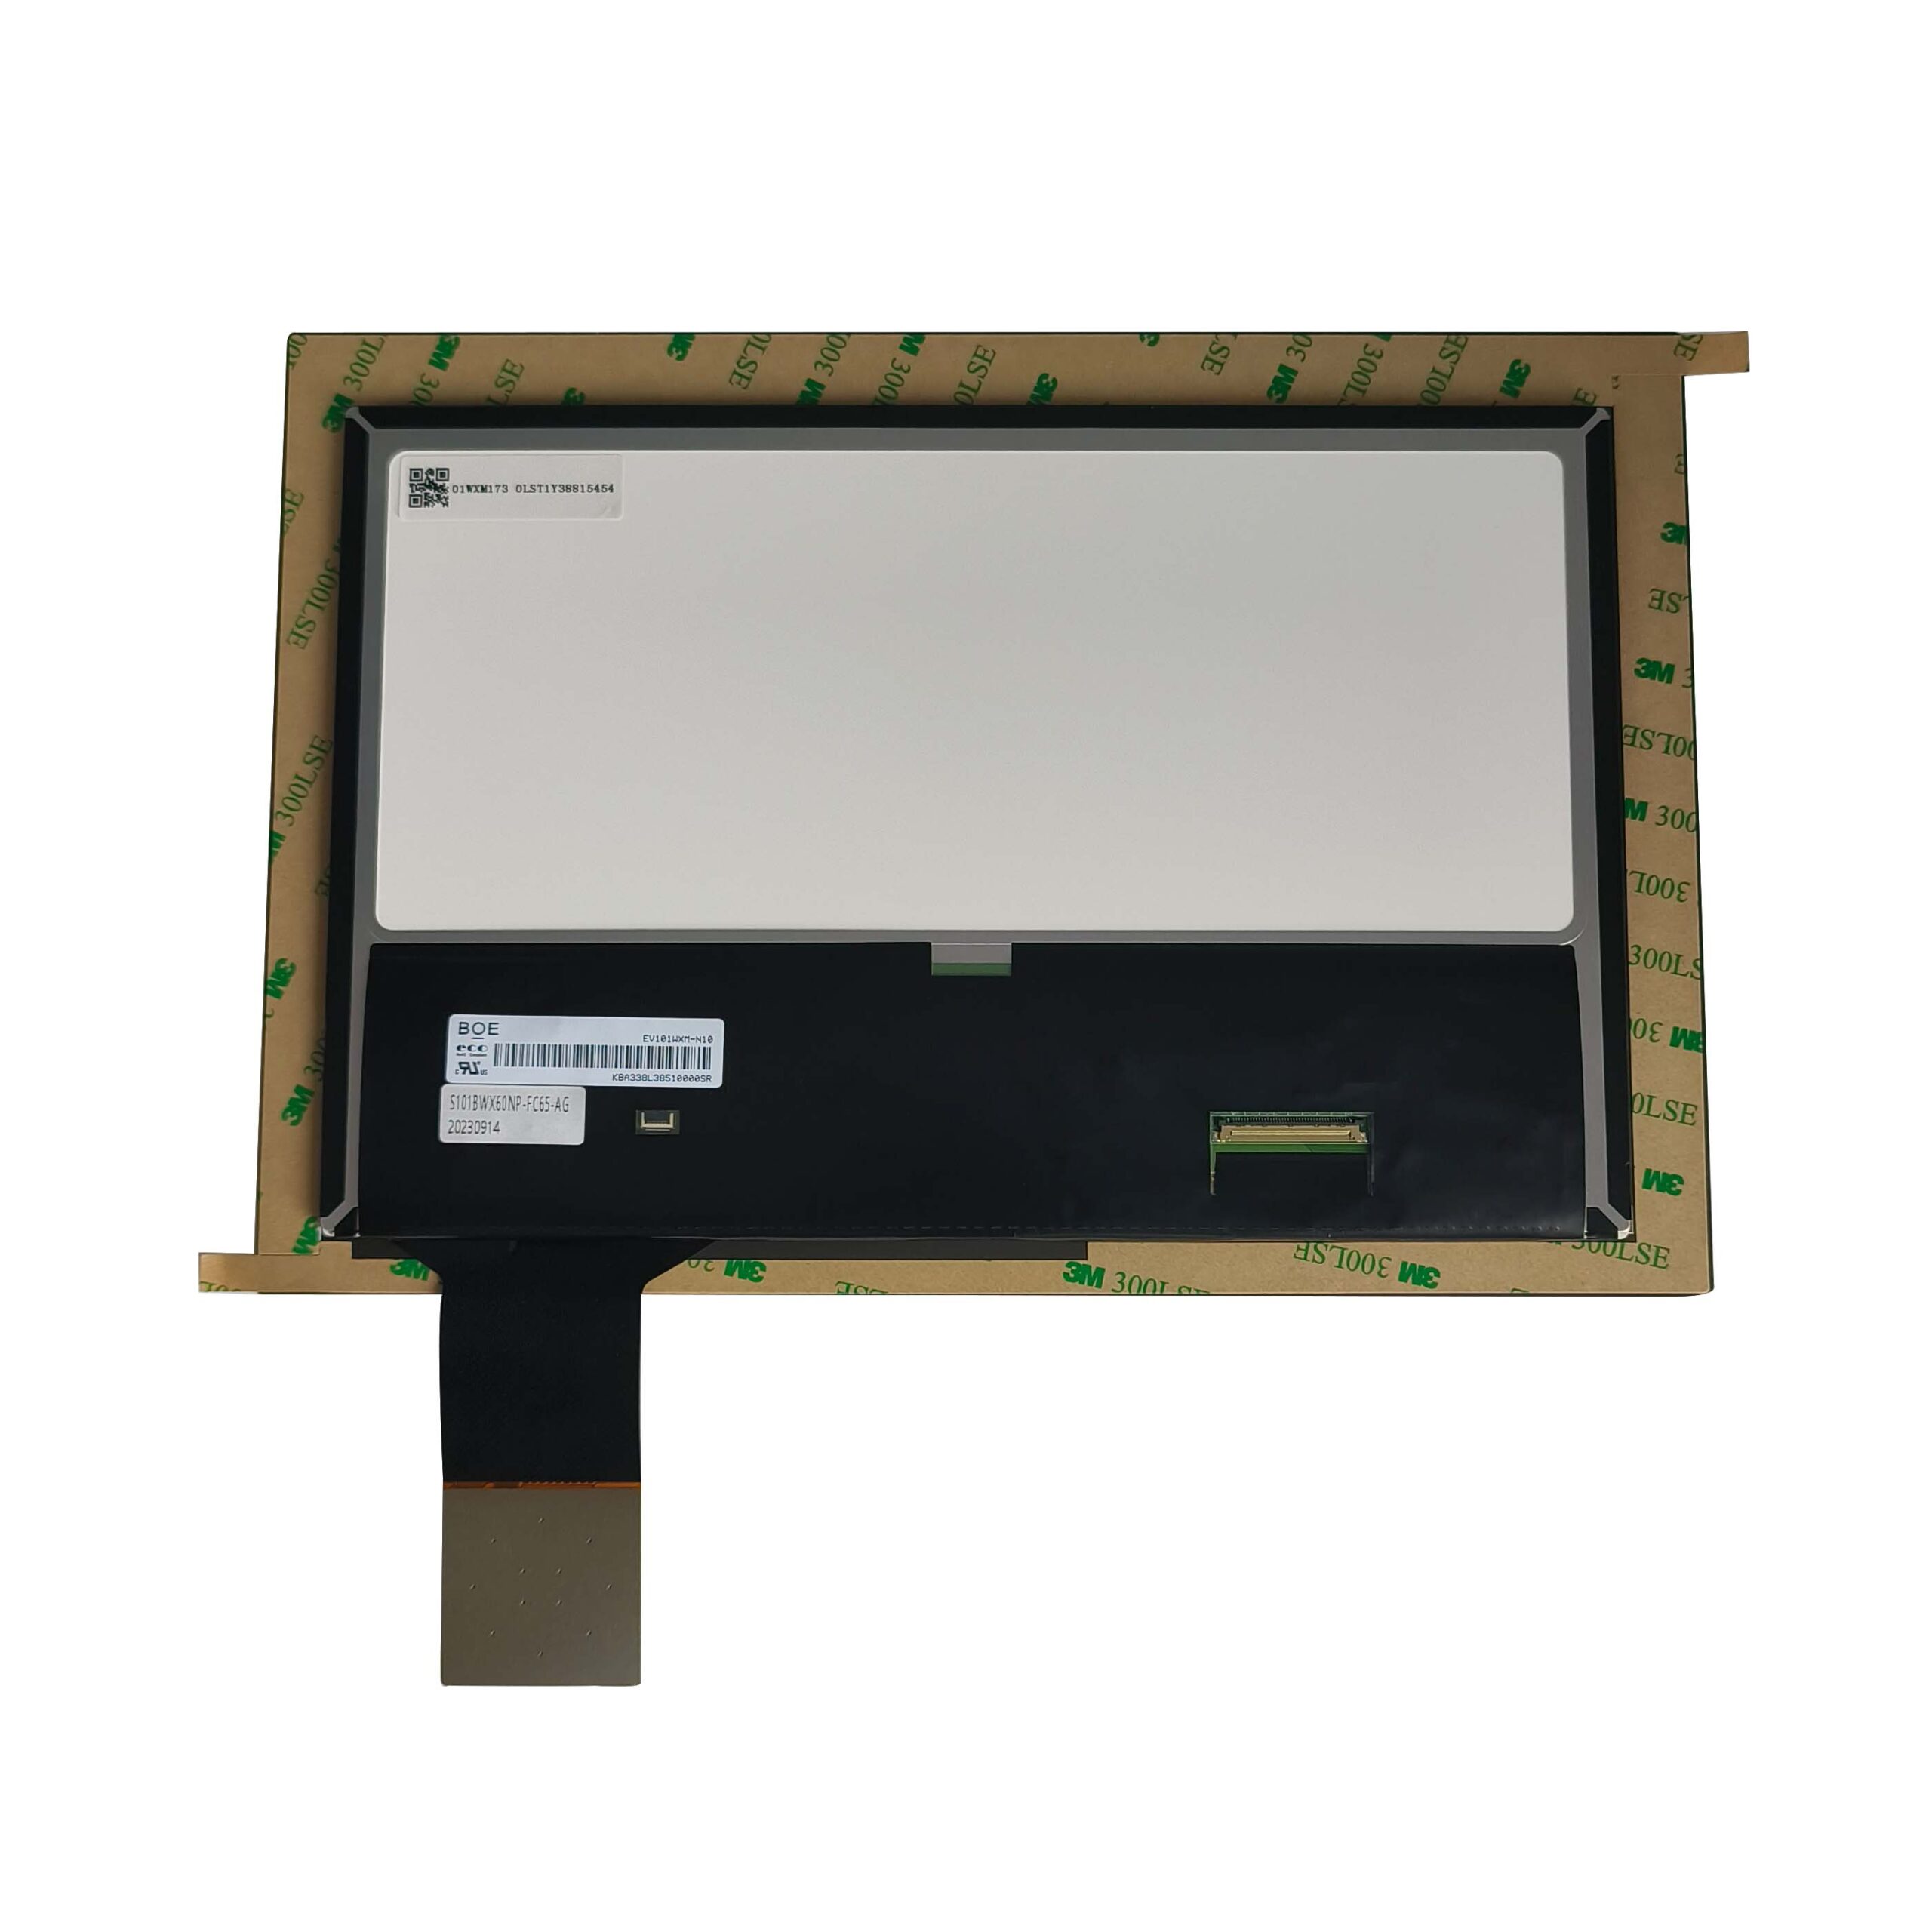
Cover glass is where optics, mechanics and touch meet, and most of its problems are decided in the drawing rather than in the process. Thickness sets impact resistance and touch sensitivity; printing creates a step the adhesive must accommodate; the edge treatment determines whether a small crack propagates; and flatness determines whether bonding produces measurable distortion. Each of those is a number a buyer can specify.
Part of the Industrial LCD Displays guide — 40 articles on continuous duty, sealing and long service life outside the cabin.
Choosing thickness and strengthening for impact and weight
Strength comes from treatment, thickness adds mass and reduces sensitivity.
Chemically strengthened glass is the default for an industrial front because the ion-exchange layer resists the surface damage that leads to failure. Increasing thickness improves impact resistance but adds mass – which matters on a mounted display or a handled device – and increases the distance between the finger and a capacitive sensor. The design sequence is to set the impact requirement, choose the glass type and thickness to meet it, then size the touch sensor to the resulting distance rather than the reverse.
Where the display is small and protected by a recessed bezel, thin glass is often sufficient; where the front is exposed to impact, a laminated construction keeps fragments in place even if the outer pane breaks. CDTech’s notes on cover glass shapes, coatings and strength cover the material choices.
AG, AR and AF coatings compared by measurement
Each treatment solves a different optical problem.
| Treatment | Effect | Measurable change |
|---|---|---|
| Anti-glare (AG) | Scatters specular reflection | Haze increases; gloss falls |
| Anti-reflective (AR) | Reduces reflected energy at interfaces | Reflectance falls; transmission rises |
| Anti-fingerprint (AF) | Reduces smearing from contact | Surface energy changes; friction changes |
| Hard coat | Improves scratch resistance | Pencil hardness result; haze after abrasion |
| AG + AR combined | Low peak glare and low total reflection | Both haze and reflectance specified |
Specifying a treatment by name is not enough, because two suppliers’ “AG” can differ substantially in haze. State the measured values – haze and gloss for AG, reflectance for AR – and the durability requirement after abrasion. The measurement methods are described in CDTech’s notes on haze, gloss and surface treatment.
Haze, gloss and transmission targets
Clarity and glare control trade against each other.
Haze scatters transmitted light as well as reflected light, so a high-haze anti-glare surface reduces glare but also softens the image – which matters for fine text and thin lines. Gloss describes how sharply the surface reflects, and transmission describes how much light passes through, both of which are measurable and comparable. The practical approach is to set a haze range for the application: lower where the display carries fine detail and the ambient light is moderate, higher where the surface faces a bright source.
Transmission losses from coatings and the glass itself accumulate with bonding adhesive and polarisers, so a stack can lose a noticeable fraction of the backlight’s output. Calculating the stack transmission before choosing the backlight brightness avoids over-specifying the panel.
Ink printing, step height and the step trap
Print creates a step that the bonding process must handle.
Printed borders and icons are typically 5 to 20 micrometres thick, which is small in mechanical terms but significant when an adhesive layer is only a few tens of micrometres thick. A print step can create an adhesive thickness change that shows as a visible line, a bonding void along the print edge, or a weak point that delaminates in thermal cycling. The design responses are to keep print away from the critical optical area, specify the ink thickness, and design the print geometry so the step is not adjacent to the active area boundary.
Where a design requires print inside the viewing area, the bonding process must be qualified for the step height, and the inspection standard should include the print edge explicitly.
Edge treatment, chamfering and micro-cracks
Failure starts at the edge.
Cut glass edges contain micro-cracks, and under load or thermal cycling those cracks propagate – particularly if the edge is unprotected. Grinding, polishing, chamfering and, where appropriate, chemical edge treatment all reduce the risk, and the choice determines both the mechanical safety margin and the appearance of the front. An exposed, sharp edge is also a handling hazard during assembly and a damage point in service.
Specify the edge finish in the drawing, including the chamfer angle and the required edge quality, and require inspection of the edge after cutting. Where the front is bonded into a bezel, the bezel should protect the edge rather than load it.
Bonding flatness and optical distortion
Flatness errors become visible after bonding.
Glass flatness and thickness variation translate into adhesive thickness variation, which produces optical distortion – visible as a wavy image at the edges or as uneven luminance on a uniform field. The tolerances that matter are the flatness of the glass and the thickness consistency of the adhesive layer, and both should be stated in the assembly drawing rather than assumed. For large or thin glass, the assembly may need a carrier or a bonded stiffener to keep the stack flat.
Inspection should include a uniform grey field view at the intended viewing distance, since distortion that is invisible in photographic content is obvious on a flat field.
Touch sensor integration on the glass
The sensor can be on the cover glass, on the display, or separate.
Placing the sensor on the cover glass shortens the distance to the finger and improves sensitivity, at the cost of a more complex and more expensive cover glass. Placing it on the display or on a separate film layer is cheaper but reduces coupling, especially through thick glass. The choice interacts with the touch controller tuning and with the optical stack, so the glass, sensor and controller should be specified together rather than sequentially.
Where the sensor is integrated, the cover glass supplier and the touch controller supplier have to work to a common electrode design, which is why specifying the whole stack with one supplier reduces integration risk. CDTech’s notes on custom touch panel manufacturing describe the process steps involved.
Tooling cost and minimum order quantities
Custom shapes are tooling projects.
Cover glass tooling covers the cutting or forming process, printing screens, coating setup and inspection fixtures. The cost is amortised over the order quantity, and the minimum order quantity is usually set by the printing and coating setup rather than by the glass itself. Where a programme’s volume is uncertain, a standard rectangular format with a printed border achieves most of the visual intent without a new glass shape.
Tooling ownership should be documented, along with the conditions for transferring it if the supplier changes.
Optical performance measurement buyers can repeat
Four measurements cover most of the optical specification.
- Haze and gloss on the production surface, at defined illumination.
- Transmission of the assembled stack, with the bonding adhesive in place.
- Reflectance of the front surface, measured in the same geometry for comparison.
- Uniformity and distortion under a uniform grey field, at the intended viewing distance.
Running these on incoming samples and after thermal cycling gives a comparison that spans the supply relationship rather than a single delivery. Haze measurement is defined by ASTM D1003, hardness by ASTM D3363, and substrate properties are published by glass suppliers such as AGC and SCHOTT.
Specification template for a cover glass drawing
Every line below corresponds to a decision that is expensive to change later.
| Item | Specify |
|---|---|
| Material and thickness | Glass type, strengthening method, nominal thickness with tolerance |
| Surface treatment | AG, AR, AF or combination, with haze, gloss and reflectance values |
| Hardness and durability | Pencil hardness result; haze after defined abrasion cycles |
| Printing | Ink type, thickness, colour reference, distance from active area |
| Edges | Finish, chamfer, quality requirement, handling protection |
| Flatness | Flatness limit and thickness variation, with the measurement method |
| Sensor integration | On-glass, on-display or film; electrode design ownership |
| Bonding interface | Adhesive type, thickness range, step handling at print edges |
| Tooling | Ownership, amortisation basis, transfer conditions |
A drawing that carries these parameters removes most of the ambiguity from a cover glass programme and makes the incoming inspection criteria obvious.
FAQ
How thick should display cover glass be?
Thick enough to meet the impact requirement, and no thicker. Chemically strengthened glass at 1.1 to 3 mm covers most industrial applications, with laminated construction where fragment retention matters. Thickness also reduces capacitive touch sensitivity, so the sensor must be matched to the chosen thickness.
What is the difference between AG, AR and AF coatings?
Anti-glare scatters reflection to reduce peak glare and increases haze; anti-reflective reduces the total reflected energy and raises transmission; anti-fingerprint reduces smearing from contact. They are specified by measured values – haze, gloss, reflectance – rather than by name, because products differ substantially between suppliers.
Why does printed ink cause bonding defects?
Print creates a step of several micrometres on a surface where the adhesive layer may be only tens of micrometres thick, producing thickness variation, voids along the print edge and a weak point for delamination. Keep print out of the critical optical area and qualify the bonding process for the step height.
How is cover glass performance verified?
With four repeatable measurements: haze and gloss on the surface, transmission of the assembled stack, reflectance of the front, and uniformity with distortion under a uniform grey field. Running them on incoming samples and after thermal cycling gives a comparison across the supply relationship rather than a single delivery.
Does cover glass need to be custom shaped?
Only where the shape is a product requirement. A standard rectangular format with a printed border achieves most of the visual intent without the tooling, printing-setup and minimum-order implications of a custom shape, and it keeps the glass supply simpler over the product’s life.
Next step
Send the mechanical envelope, impact requirement, optical targets and viewing conditions to CDTech; the reply will propose the glass type, thickness, coatings and print layout with the measurements that verify each one.
Contact sales@cdtech-lcd.com or use the contact page.
Related articles
 Solar Inverter and Combiner Box Displays: Readability in Direct SunlightIndustrial & Specialist DisplaysTransparent, Reflective and High-Ambient Retail Displays: Where LCD Still WinsIndustrial & Specialist Displays
 Passenger Information Displays for Buses and Trains: Standards, Readability and ReliabilityIndustrial & Specialist DisplaysLong Display Cables in Industrial Machines: Signal Integrity Without an Expensive RedesignIndustrial & Specialist Displays