How Can You Design a Ghost-Free High-Refresh Waveform Display?
A high-response bar-type TFT display for audio VU meters, dynamic waveforms, and medical telemetry needs more than a 60 Hz specification. It requires low gray-to-gray transition time, sufficient interface bandwidth, stable frame pacing, waveform-focused…

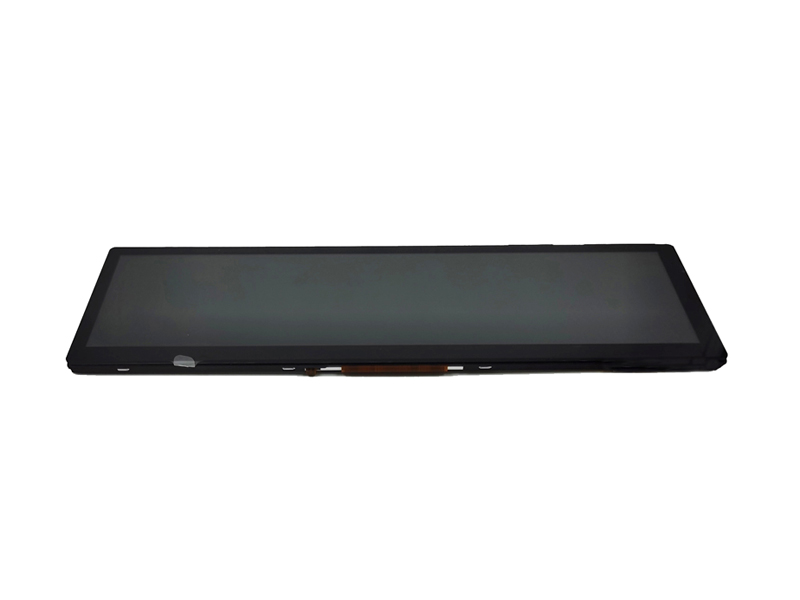
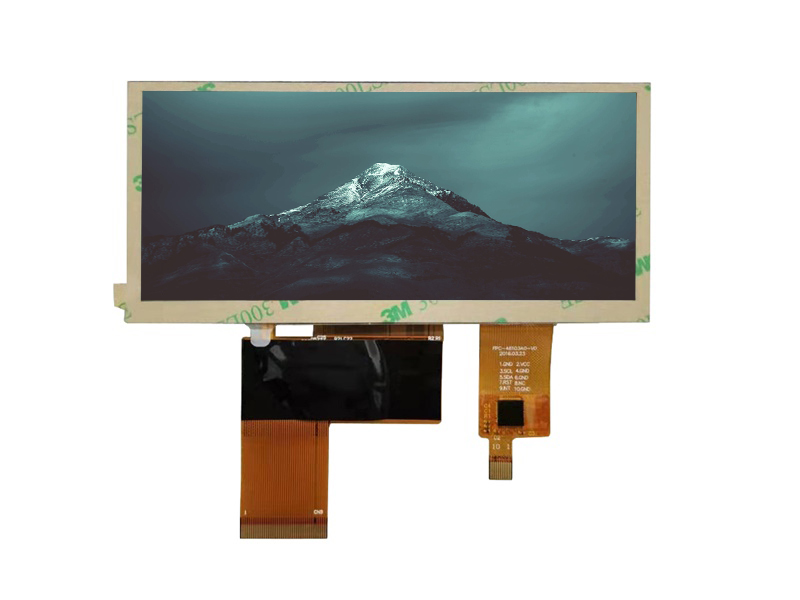
A high-response bar-type TFT display for audio VU meters, dynamic waveforms, and medical telemetry needs more than a 60 Hz specification. It requires low gray-to-gray transition time, sufficient interface bandwidth, stable frame pacing, waveform-focused UI rendering, and optical tuning. A correctly engineered CDTech stretched display makes fast traces appear continuous rather than smeared, delayed, or broken.
audio equipment sub-panel real-time rendering
What Makes a Dynamic Waveform Look Smooth?
A dynamic waveform looks smooth when the system acquires data, renders pixels, transmits frames, and switches liquid-crystal states fast enough that the trace advances predictably. Refresh rate matters, but pixel response time, rendering strategy, input latency, and the persistence of the LCD image determine whether users perceive a clean live signal.
For an audio VU meter, spectrum bar, oscilloscope-style waveform, ECG trace, or SpO₂ plethysmography waveform, the screen is not simply showing animation. It is presenting time-sensitive information that users scan continuously.
At 30 Hz, one complete frame lasts approximately 33.3 ms. At 60 Hz, that interval falls to approximately 16.7 ms. A waveform moving horizontally therefore receives twice as many positional updates every second on a 60 Hz panel.
However, a fast input stream alone cannot eliminate blur. If the liquid-crystal pixels require too long to transition between mid-gray levels, the newly drawn trace overlaps visually with the previous one. This causes physical afterimage, commonly described as ghosting or smearing.
In production validation, we distinguish four independent delays:
-
Signal acquisition delay from audio ADC, ECG front end, or sensor controller
-
MCU, MPU, FPGA, or SoC waveform-rendering delay
-
Display-interface transmission delay
-
LCD pixel-transition delay, particularly gray-to-gray behavior
A display can accept a 60 Hz signal and still exhibit poor live waveform readability if its mid-tone transitions are slow. This is especially visible with cyan, green, amber, and white waveforms traveling across a dark background.
How Does 60 Hz+ Compare With a 30 Hz Bar Display?
A 60 Hz+ display updates the image every 16.7 ms or faster, while a 30 Hz display updates every 33.3 ms. For scrolling traces and meter peaks, the higher-refresh configuration reduces position stepping, improves peak capture perception, and gives operators a more immediate visual relationship with the live signal.
The practical difference becomes obvious when a trace travels across a narrow panel. Consider a 1,280 × 320 display presenting a 10-second ECG history. If the waveform scrolls at 128 pixels per second, a 30 Hz screen advances about 4.3 pixels per frame. A 60 Hz screen advances about 2.1 pixels per frame.
The 30 Hz trace can look like a sequence of small jumps, particularly if antialiasing, slow GtG response, or inconsistent rendering timing is present. At 60 Hz, the eye receives a more continuous progression, making it easier to observe irregular rhythm changes, transient clipping, or sudden level movement.
CDTech can help match panel timing, interface configuration, and controller performance so the host system can sustain real 60 Hz operation rather than merely accepting a nominal 60 Hz input format.
Why Is Gray-to-Gray Response More Important Than a Marketing Speed Claim?
Gray-to-gray response time measures how quickly a pixel changes between intermediate luminance levels. Since live waveforms usually move between dark backgrounds and colored or light trace values, GtG behavior is more relevant than a black-to-white-to-black response figure when assessing ghosting.
A VU display may use a black background with green bars, yellow warning segments, red peak indicators, and dim inactive graduations. An ECG monitor may draw green or cyan lines over a dark gray background. These are primarily intermediate transitions, not full black-to-white changes.
For this reason, engineering teams should request actual response-time characterization rather than relying on one headline number. A useful qualification target for a fast telemetry display is typically:
-
Average GtG: 10 ms or lower for 60 Hz waveform applications
-
Worst-case critical transition: verified for trace colors and backgrounds
-
No excessive overshoot: avoid bright halos ahead of the moving line
-
Stable response across expected operating temperature
-
No visible trailing afterimage during continuous horizontal scrolling
In our factory-side reviews, the most misleading result comes from testing only a white cursor on a black background. That transition can look acceptable while a dim green waveform leaves a long tail over a dark blue-gray UI.
The proper test sequence includes the actual intended colors, line widths, brightness settings, and background tone. A 1-pixel cyan trace and a 3-pixel green trace can produce very different ghosting results on the same panel because the voltage transition paths are different.
Which Tests Reveal Motion Blur and Physical Afterimage?
The most useful test combines high-speed-camera capture, scrolling test patterns, waveform playback, and temperature conditioning. It should measure both the signal-to-screen delay and the visible residual trace left behind a moving waveform.
A reliable validation program should include these tests:
-
Scrolling single-line test: Move a 1-pixel white, green, cyan, and amber line over the actual UI background at representative speed.
-
Peak-bar test: Drive a vertical VU bar through rapid rise and fall cycles, including hold-peak behavior and red-zone activation.
-
Live-data playback: Feed prerecorded ECG, arrhythmia, audio transients, clipping events, and fast sensor events through the final software stack.
-
High-speed camera test: Capture the display at 240 fps or higher to identify trace tails, missed frames, tearing, uneven scroll increments, and overshoot artifacts.
-
Temperature test: Repeat the test at low, room, and high operating temperatures. LCD response frequently slows at low temperature.
-
Long-duration burn-in test: Run a scrolling waveform for 24 to 72 hours to identify thermal drift, backlight instability, panel-drive abnormalities, or controller-memory leakage.
A common mistake is to test the panel only with the supplier’s color-bar pattern. That verifies basic operation, not waveform quality. The finished device must be tested with the final bezel, cover lens, optical bonding condition, brightness setting, and intended firmware.
How Should Engineers Set Refresh Rate and Interface Bandwidth?
Engineers should calculate interface bandwidth from resolution, color depth, refresh rate, blanking overhead, and margin. The selected interface must sustain the required frame rate without frame drops, reduced color depth, or firmware-driven partial-update bottlenecks.
For a 1,280 × 320 RGB display at 60 Hz with 24-bit color, active video alone requires approximately:
After adding synchronization and blanking intervals, practical bandwidth requirements rise further. The exact figure depends on panel timing. This is why the host interface and display timing must be reviewed together.
For compact instrumentation, common choices include:
-
RGB parallel for straightforward short-distance board integration
-
MIPI DSI for high pixel bandwidth with lower pin count
-
LVDS for robust medium-to-high-resolution connections and improved noise tolerance
-
HDMI for external or modular display assemblies
A 30 Hz system may appear sufficient during static screen testing, but it can fail when the interface must also handle touch events, alarms, font rendering, data logging, or graphical overlays. Reserve processing and memory bandwidth rather than designing at the theoretical limit.
CDTech engineering teams typically request the target resolution, host processor, interface, desired refresh rate, luminance, operating temperature, viewing distance, and waveform speed before recommending a customized long-bar TFT configuration.
What Rendering Methods Prevent Tearing and Trace Jitter?
The best approach uses double buffering, vertical-sync-aware swaps, partial redraw regions, deterministic sample timing, and a fixed horizontal scroll increment. These methods prevent the waveform from tearing across frames or appearing to speed up and slow down under processor load.
For a real-time display, waveform data should be sampled independently from the screen-refresh cycle. The renderer then maps buffered samples to pixels at a fixed display cadence.
A practical architecture is:
-
Acquire sensor or audio data at a fixed sample rate
-
Store samples in a circular buffer
-
Render only the changed trace region
-
Synchronize buffer swaps to the display vertical blanking period
-
Keep the scroll rate constant in pixels per frame
-
Draw alarms and labels in separate layers when possible
For example, an ECG engine may sample at 250 Hz, 500 Hz, or 1 kHz, while the display refreshes at 60 Hz. Do not redraw the entire screen once for every incoming sample. Instead, preserve the acquisition timeline, interpolate or decimate as needed, and update the trace at controlled display intervals.
In audio equipment, users are very sensitive to peak timing. If the audio DSP detects a transient but the peak LED region appears 70 to 100 ms later, the product feels unresponsive. We normally recommend establishing a full end-to-end latency budget before selecting the panel, not after the industrial design has frozen the display opening.
When Does a 30 Hz Display Still Make Sense?
A 30 Hz display can be suitable for slow-changing status panels, static parameter screens, configuration menus, basic temperature indicators, and low-speed industrial readouts. It becomes a weak choice when users must judge rapid trends, transient peaks, or continuously moving physiological traces.
Use 30 Hz when:
-
The information changes once per second or less
-
The screen mostly shows numbers, icons, and static labels
-
Power consumption and host performance are more important than motion quality
-
The trace is slow enough that visible stepping is acceptable
-
The device is a low-cost non-critical indicator rather than an active monitoring interface
Avoid 30 Hz for:
-
Professional audio VU meters and peak-program meters
-
Real-time FFT spectrum displays
-
Oscilloscope-style waveforms
-
ECG, respiratory, and plethysmography traces
-
Fast industrial process telemetry
-
Automotive performance instrumentation
-
Compact diagnostic devices where trend visibility affects decisions
The right choice is not simply “higher refresh is always better.” It is about matching the panel’s refresh behavior and pixel response to the information speed, operator viewing distance, and safety consequences of missed visual changes.
Can a Long Bar Display Be Customized for Audio and Medical Devices?
Yes. A custom stretched TFT LCD can be specified around the enclosure geometry, interface, brightness, viewing angle, touch structure, cover glass, operating temperature, and waveform application. The strongest designs begin with the real data flow and mechanical space rather than choosing a panel solely by diagonal size.
For professional audio, common requirements include a wide horizontal viewing angle, dark-state uniformity, low-glare cover glass, dimming control, fast bar-graph response, and accurate color separation between normal, warning, and clip regions.
For medical telemetry, design priorities often shift toward high reliability, stable brightness, clear readability under room lighting, disinfectant-resistant front surfaces, controlled electromagnetic behavior, and sustained operation.
CDTech supports bar-type TFT solutions across multiple sizes and resolutions, including compact narrow formats for mixers and instruments as well as wider formats for bedside, portable, and laboratory equipment. Customization can include:
-
Resolution and active-area selection
-
60 Hz or higher frame operation where the platform supports it
-
RGB, MIPI, LVDS, HDMI, or other appropriate interfaces
-
IPS viewing-angle configuration
-
Projected capacitive touch or non-touch designs
-
Optical bonding or air-gap construction
-
High-brightness backlight options
-
Custom FPC, connector direction, mounting holes, and cover-lens printing
-
Wide-temperature component selection
CDTech Expert Views
“A waveform screen should be evaluated as a measurement surface, not as decorative UI. In real production runs, we have seen a panel pass a general video demo but fail a one-pixel green trace test because the gray transition was too slow at 0°C. For audio and telemetry products, define the trace color, background color, line width, sweep speed, brightness, and operating temperature before approving the display. CDTech recommends validating the complete signal chain—from sensor acquisition to final pixel transition—using the customer’s actual waveform data. This exposes tearing, dropped frames, and residual tails before tooling, when correction is still economical.”
Where Do Projects Commonly Fail During Display Integration?
Most failures occur when the panel is selected before confirming host bandwidth, real temperature behavior, UI colors, optical stack, and production test criteria. These problems often emerge late, after mechanical tooling or firmware architecture has already constrained the available options.
The most frequent failure modes include:
-
Nominal 60 Hz without sustained 60 Hz rendering: The host processor reaches 60 Hz only on a blank screen, then drops frames when text, touch, alarms, and waveform rendering operate together.
-
Incorrect GtG assumption: The panel has an acceptable black-white figure but leaves color-specific tails during actual waveform movement.
-
Low-temperature ghosting: Response slows in a cold room, ambulance, outdoor installation, or unheated instrument enclosure.
-
Overdrive overshoot: Aggressive drive tuning makes the waveform look sharper but creates bright or dark halos around moving lines.
-
Tearing from unsynchronized updates: The waveform appears split horizontally when the frame buffer is changed during scanout.
-
Brightness-uniformity mismatch: A narrow display looks uneven because the backlight and optical films were not evaluated in the final mechanical stack.
-
Poor cover-lens decisions: Anti-glare treatment can improve ambient-light readability but may soften fine trace edges if haze is too high.
During early engineering builds, set acceptance limits in writing. For example: no visible waveform tail exceeding two line widths at the standard viewing distance, no dropped frames during 30-minute live-data playback, and no tearing under maximum UI load.
What Should a Display RFQ Include for a Fast Waveform Product?
A complete RFQ should define electrical timing, visual performance, mechanics, environment, and qualification criteria. Giving only size and resolution usually leads to generic module recommendations that may not meet a real-time waveform requirement.
Include the waveform speed in pixels per second, desired trace colors, screen background, line thickness, and alarm behavior. These details allow CDTech to assess whether the limitation is likely to be the TFT panel, interface bandwidth, host processor, display driver, or rendering firmware.
Why Is CDTech Suitable for Custom High-Response Bar Displays?
CDTech combines TFT display design, touch integration, HDMI display solutions, and custom mechanical adaptation for industrial, medical, automotive, smart-home, and instrumentation applications. Its Shenzhen manufacturing base supports custom display development from specification review through sampling, validation, and production.
For waveform-centered products, the advantage is not merely selecting a long screen. It is coordinating the panel, controller, interface, cover lens, backlight, and qualification process around the actual use case.
CDTech can support customers that need:
-
Compact bar displays for professional mixers, rack equipment, and audio processors
-
High-clarity telemetry displays for portable diagnostic or monitoring devices
-
Customized mounting and connector orientation for restricted internal space
-
Stable supply planning for long-life equipment programs
-
Quality-management support suitable for medical and automotive-oriented projects
-
Prototype-stage review to identify response, timing, and interface risks before production
A responsive display should be treated as part of the instrument’s sensing experience. When users read a waveform to make a decision, display dynamics influence confidence, accuracy, and perceived equipment quality.
FAQs
What refresh rate is best for an ECG waveform display?
A sustained 60 Hz minimum is a practical baseline for a smooth ECG trace. Higher rates may help in specialized applications, but low gray-to-gray response, reliable frame pacing, and correct waveform rendering remain equally important.
Does a 60 Hz LCD automatically eliminate ghosting?
No. A 60 Hz input reduces frame interval, but physical ghosting depends heavily on gray-to-gray pixel transitions, temperature, panel-drive behavior, trace color, background color, and overdrive tuning.
Can an HDMI display support real-time VU meters?
Yes. HDMI can support responsive VU meter and waveform content when the source hardware renders consistently, maintains frame synchronization, and supplies enough graphics performance. Verify end-to-end latency rather than judging the interface alone.
What trace colors are easiest to read on a telemetry display?
Green, cyan, white, and amber traces on a dark neutral background are common choices. The final selection should be tested for contrast, residual ghosting, alarm differentiation, ambient-light readability, and operator viewing distance.
How can I reduce waveform tearing?
Use double buffering, synchronize buffer swaps with vertical blanking, avoid writing to the active frame buffer during scanout, and maintain a deterministic rendering schedule under maximum system load.
A high-refresh waveform display succeeds when every part of the signal chain is designed together. Specify sustained 60 Hz+ operation, test the actual GtG transitions used by the final waveform colors, validate the host’s real rendering load, and run thermal motion tests before approving tooling. For demanding audio and medical telemetry products, work with CDTech early to convert those requirements into a tested long-bar TFT solution.